Applications using
OpenLayers
https://openlayers.org/en/latest/examples/
shows more than 200 examples, based on javascript using the open source OpenLayer
package. It can bet used without installation of gis programs on user pc. Impressing possibilities! incredible number of
different data sources can be used. It
is easy to make user interactive gis programs.
I have
tried, tweaked, investigated most of these examples
Some of the
more useful, interesting, impressing examples are shown in this web-directory
Read features from ArcGIS REST-server, color map, show legend from feature attributes
https://bjarnephys.com/gis/user_geolocationHeight.html
The program is
based on fast coloring of each pixel based on the height value in the DEM layer.
Of course, data is no better than the source. The resolution appears to be
about 2m*2m, which is fine for Greenland, but not for DK, where citizens can
access layers with 0.40m*0.40m.
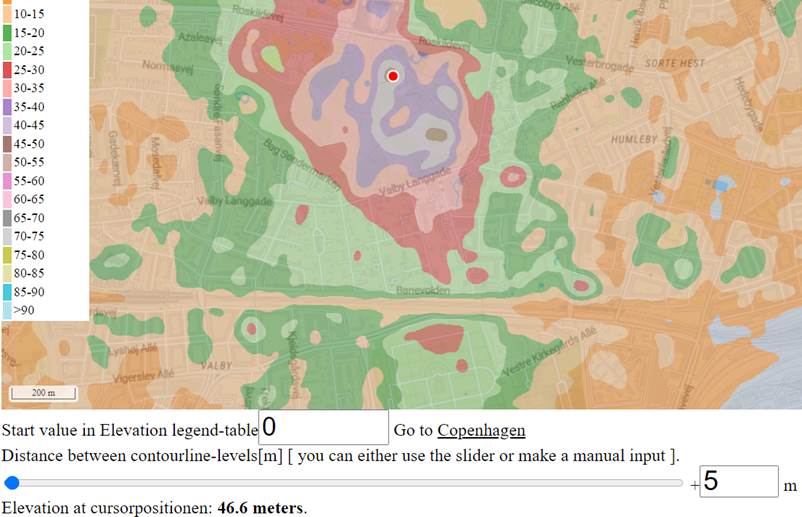
The area around Frederiksberg castle shows a maximum
height of 47m, but is in reality 37m, the contour level curves give a good
impression of the topography, however. https://www.kb.dk/danmarksetfraluften/#zoom=16&lat=55.67060030756023&lng=12.522444926964853
The map can also be used to investigate the risk of
flooding at high tide. If the height level is set to 1, one can get an overview
of the areas that are flooded at 1m high water (the map and drawing are not
precise, however); especially on Amager in Copenhagen, large areas are in a danger
zone.
Clustered features.
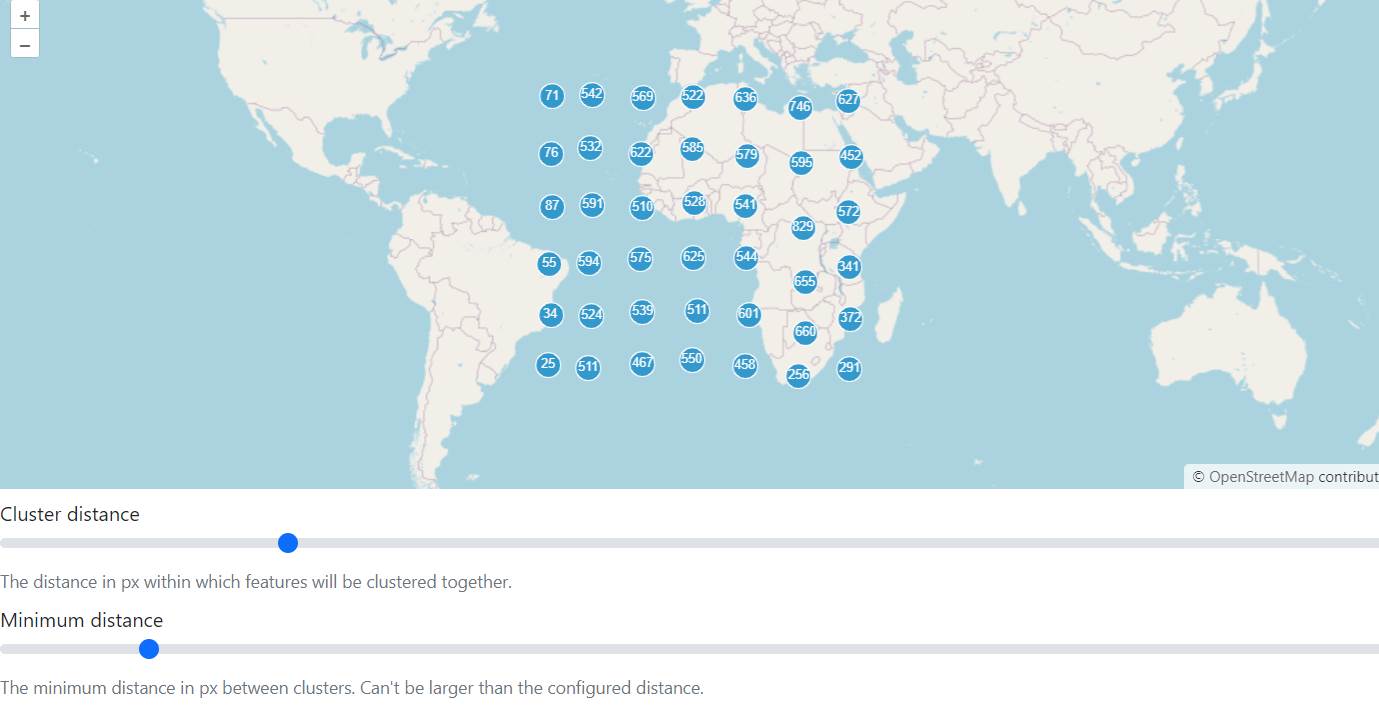
clustered_features.html
20000 points are
randomly generated in an area around Equator. The points are clustered in blue
cluster-circles. The number shows the number of points in each cluster.
If you click on a
cluster-circle, the view is changed to the extent of all points in the cluster.
It is simple to make a cluster
overlay:
const
source = new VectorSource({
features: features,
});
const
clusterSource = new Cluster({
distance: parseInt(distanceInput.value),
minDistance:
parseInt(minDistanceInput.value),
source: source,
});