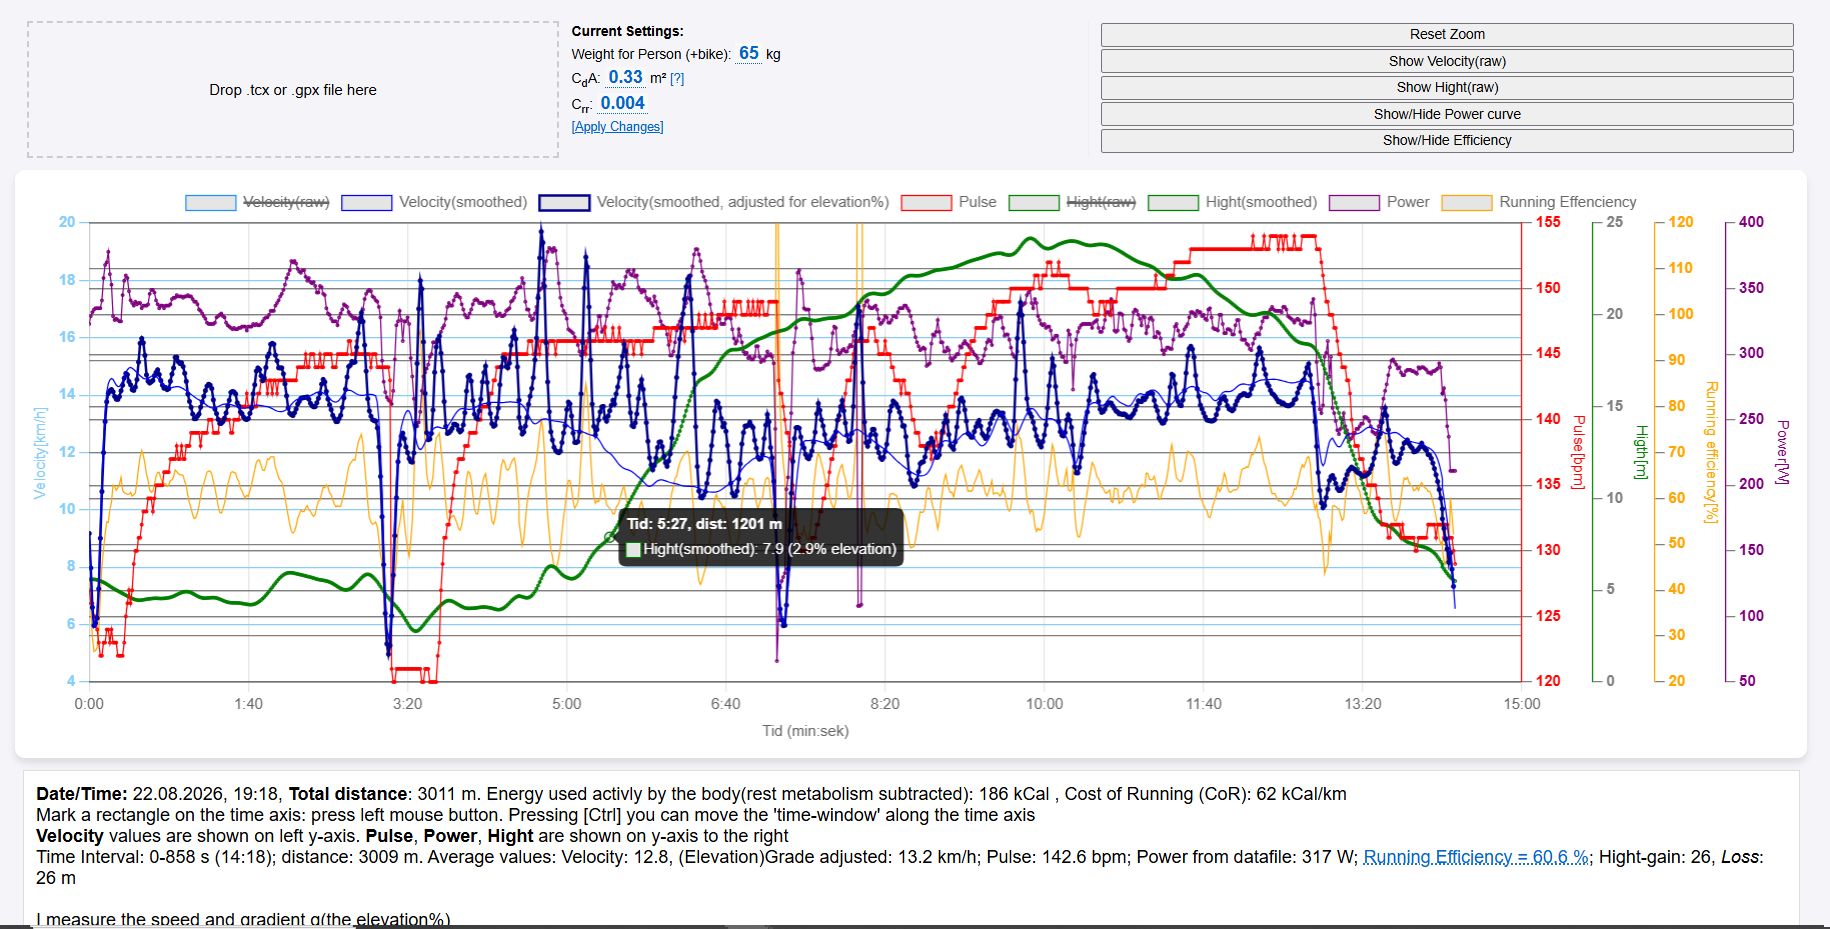
I have developed an HTML file with JS-code, Exercise-Graphs-application.htm, where you can upload a TCX or GPX exercise file to generate detailed graphs for velocity, pulse, and altitude data, for both cycling and running.
Built with JS in collaboration with Gemini AI. After in-depth analysis, I have implemented GAP-velocity (Grade Adjusted Pace) corrections for uphill/downhill segments—for instance, running at 5% incline at 12 km/h is equivalent to 13 km/h on flat ground.
Since altitude data from my Garmin Forerunner 255 (barometric) features slight 0.2m variations per second, I have implemented a weighted moving average algorithm to ensure smooth and accurate elevation and velocity curves.
The app allows you to zoom into specific time intervals to analyze performance and retrieve average values. You are welcome to download and save the HTML file for your own use.